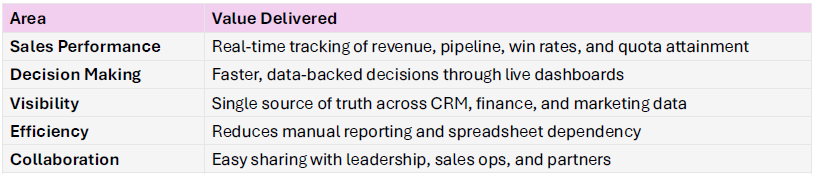
Looker Studio (Google) is a free, cloud-based data visualisation and reporting platform that transforms raw data into interactive, real-time dashboards for sales, revenue, and performance tracking.
Business Value
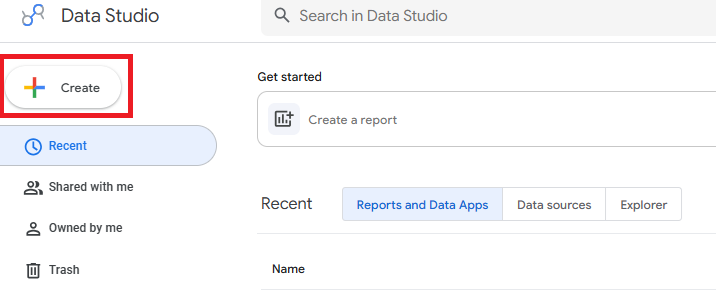
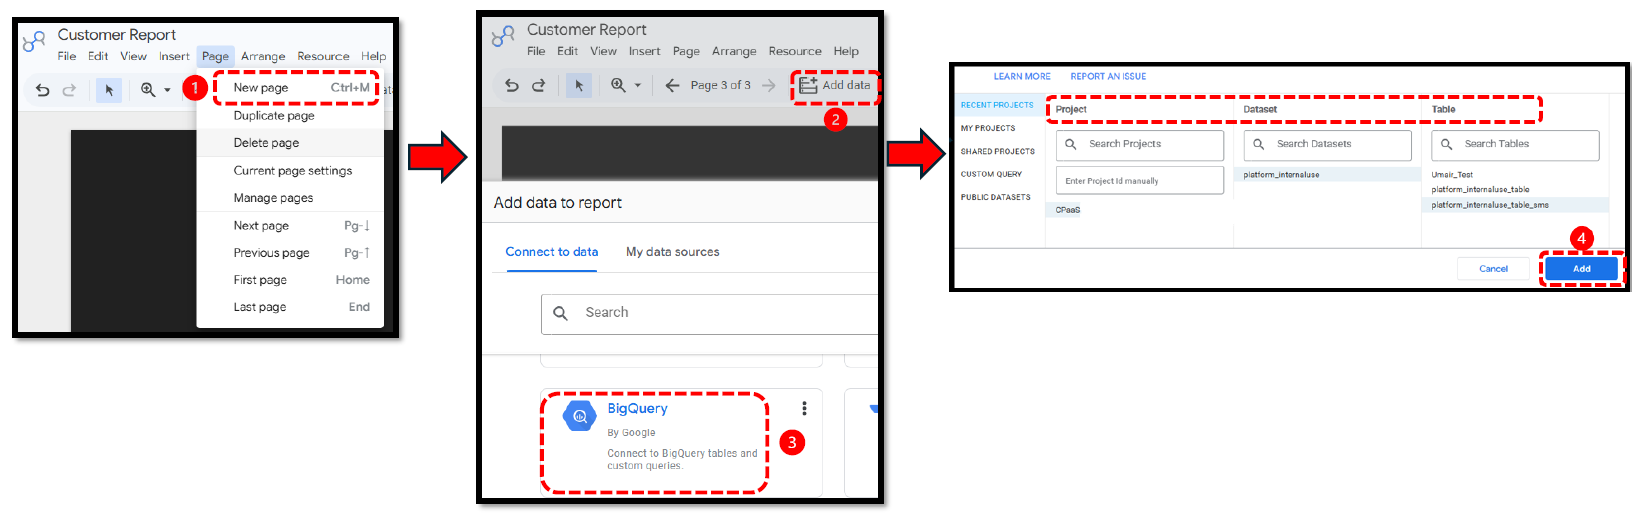
1.- Once you have a datset and table created in Google BogQuery, log in to the Looker Data Studio and Click ‘Create’
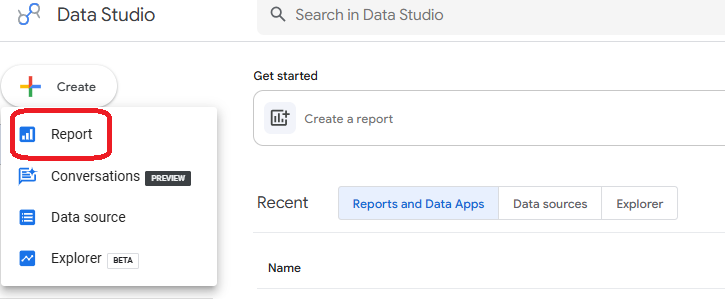
2.- Click ‘Report’ to create a new Report
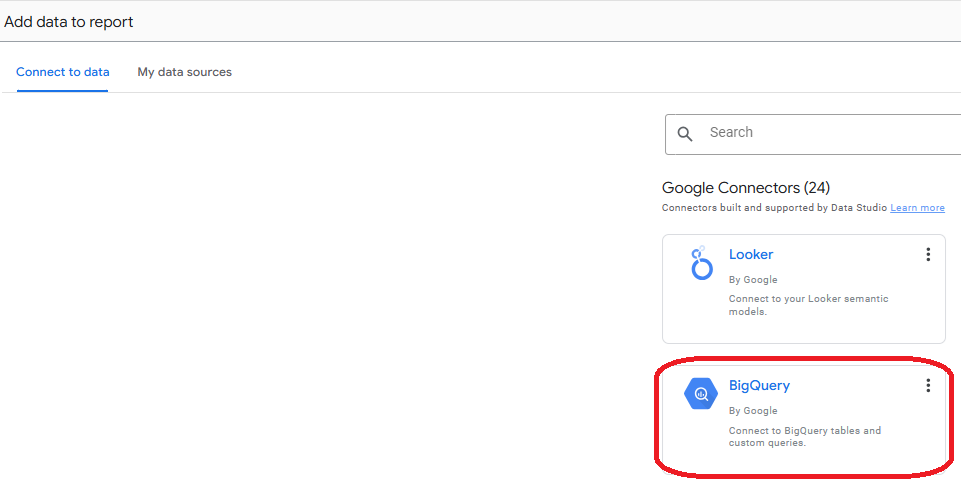
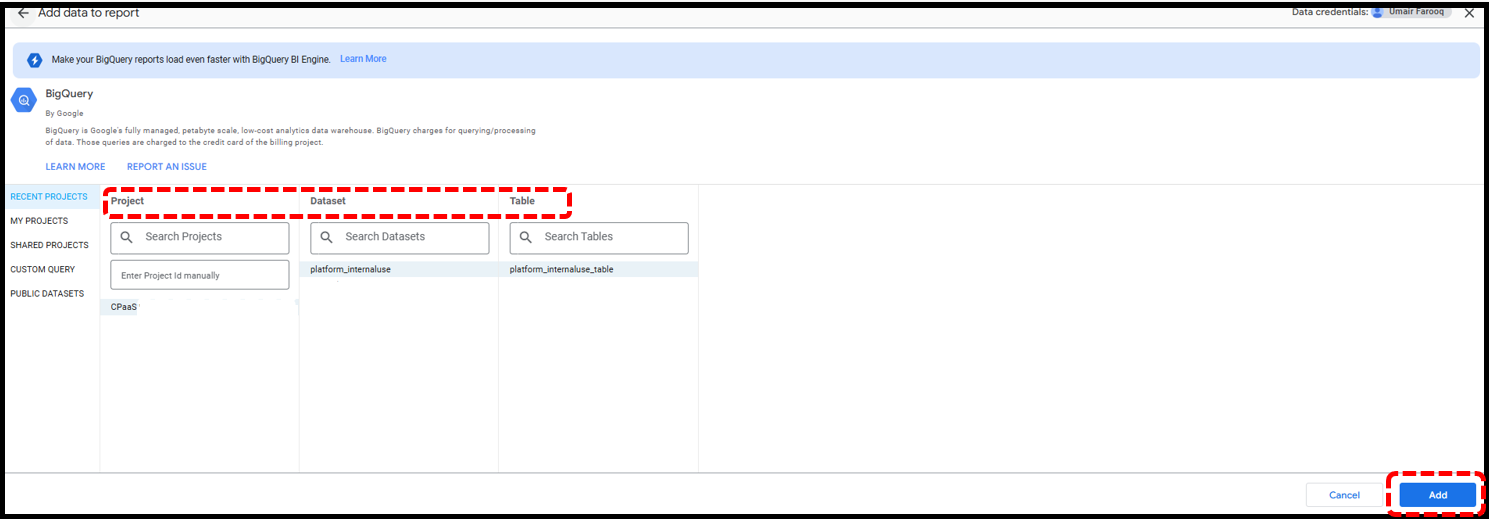
3.- At this step you need to import the data from BigQuery in Looker.Click ‘Big Query’ as that is where all your data is stored
4.- Select the correct Project, Dataset and Table and click ‘Add’ to import the table in Looker.
Note: Any changes to the table in Big Query will automatically be reflected in your visualisations in the Looker studio. Data refresh is near real-time
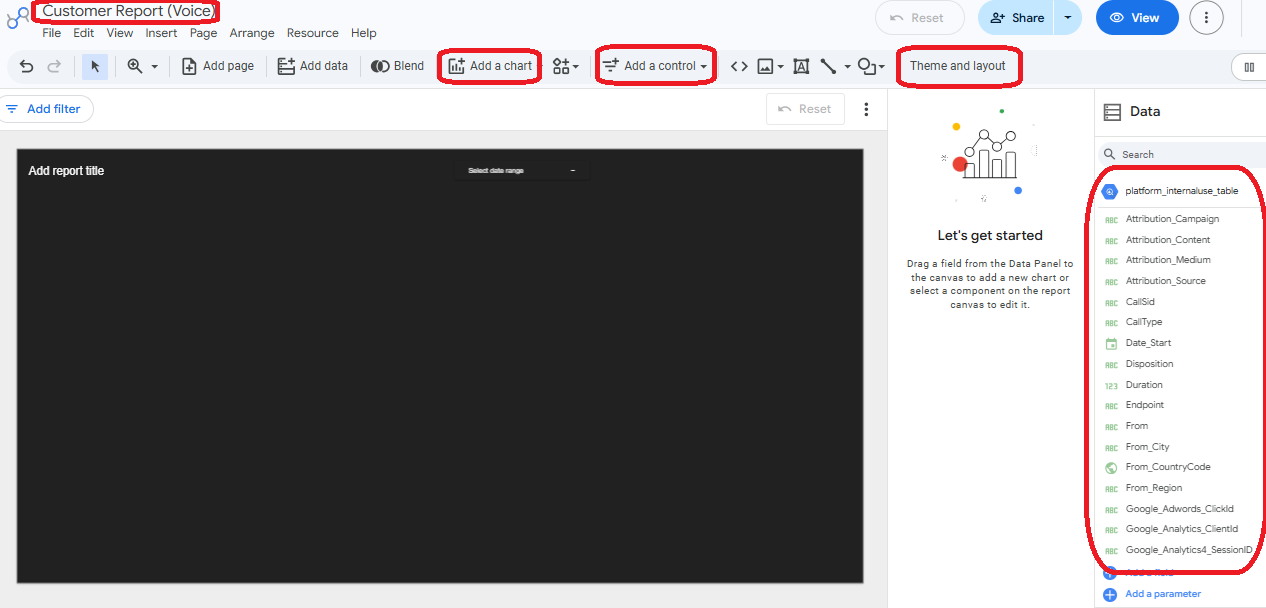
*Name the report as per your requirement
*Platform_internaluse_table shows all the columns imported from your data source in BigQuery
*You can select the theme and layout for your report here. You can also customise the standard templates in this section
*You can select the charts, tables & scorecards to add to your report
*You can add filters and lists to the report
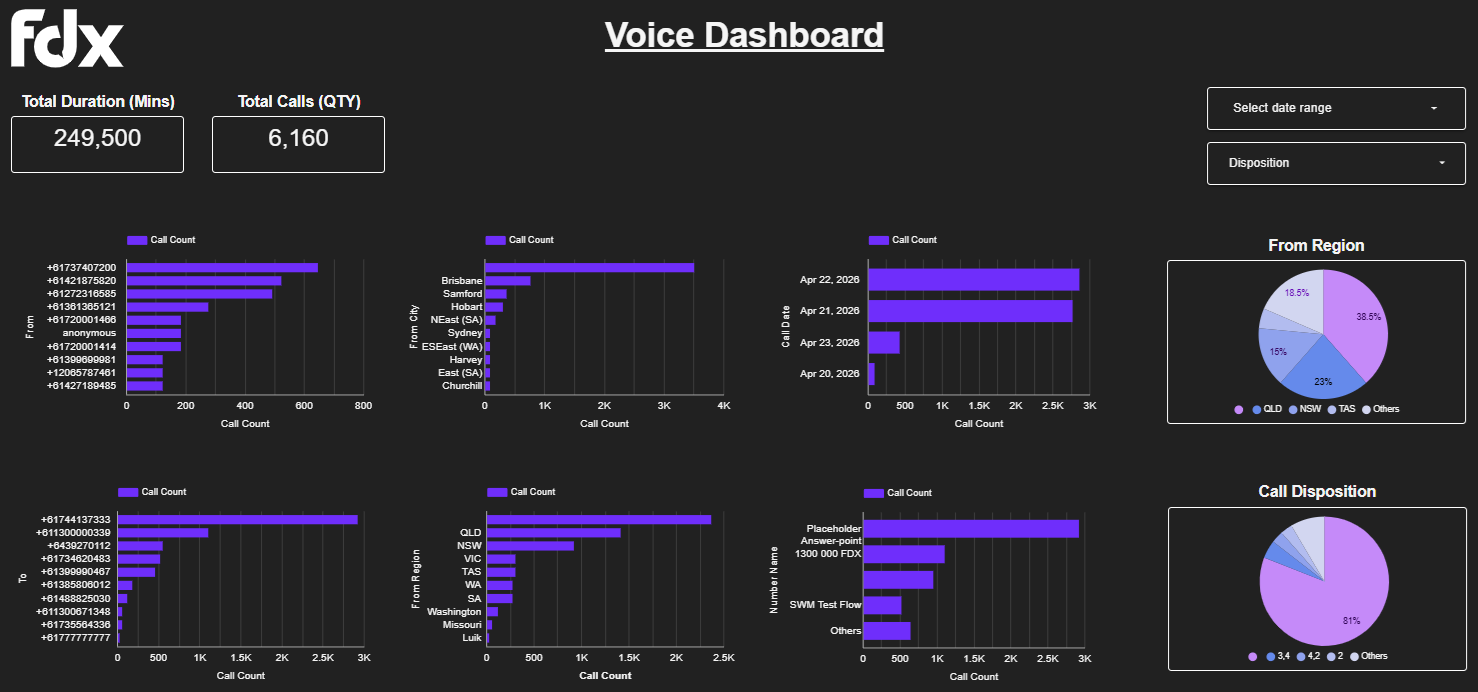
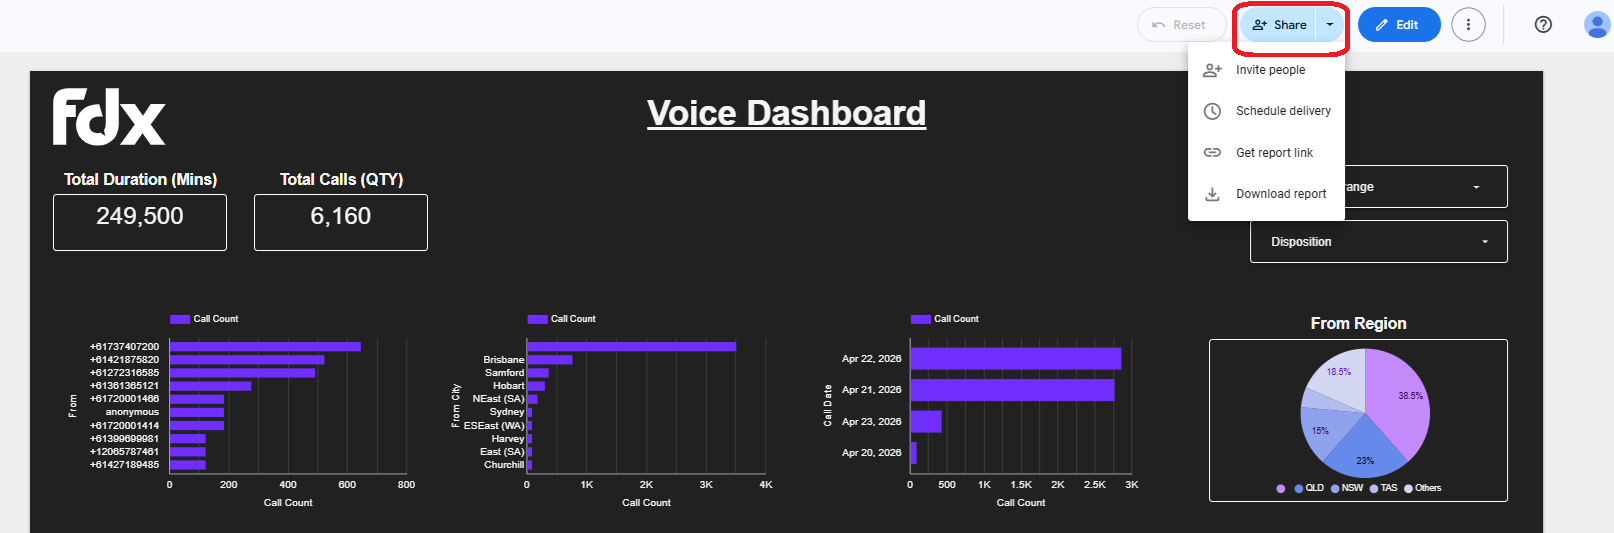
The following image shows a typical voice dashboard for a customer
*Company logo can be added
*Scorecard added from the ‘Add a Chart’ section
*Bar charts created from ‘Add a Chart’ section
*Filters added from ‘Add a Control’ section
*Pie charts created from ‘Add a Chart’ section
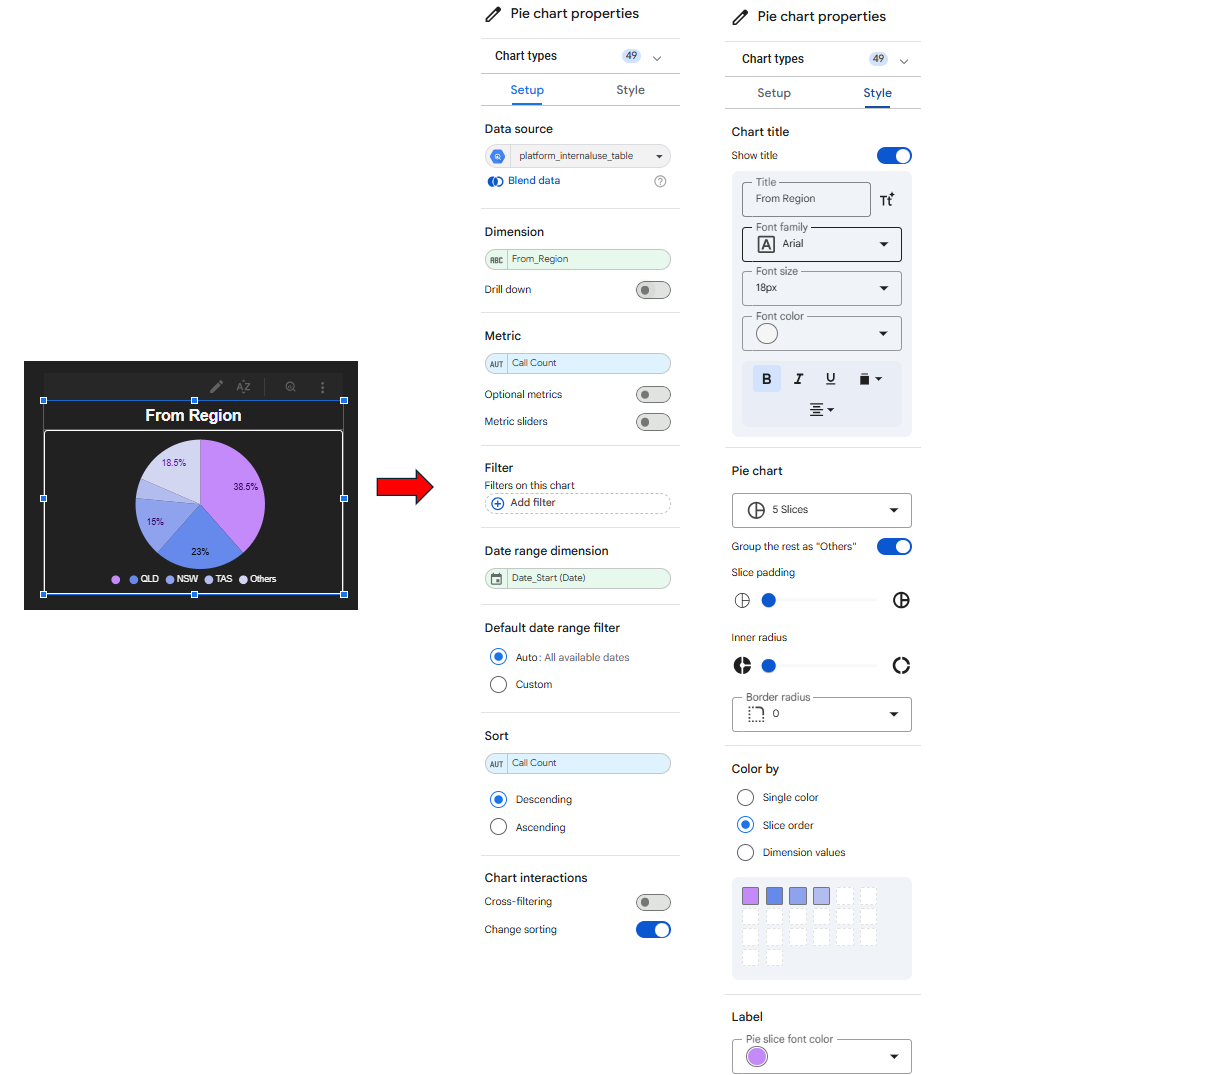
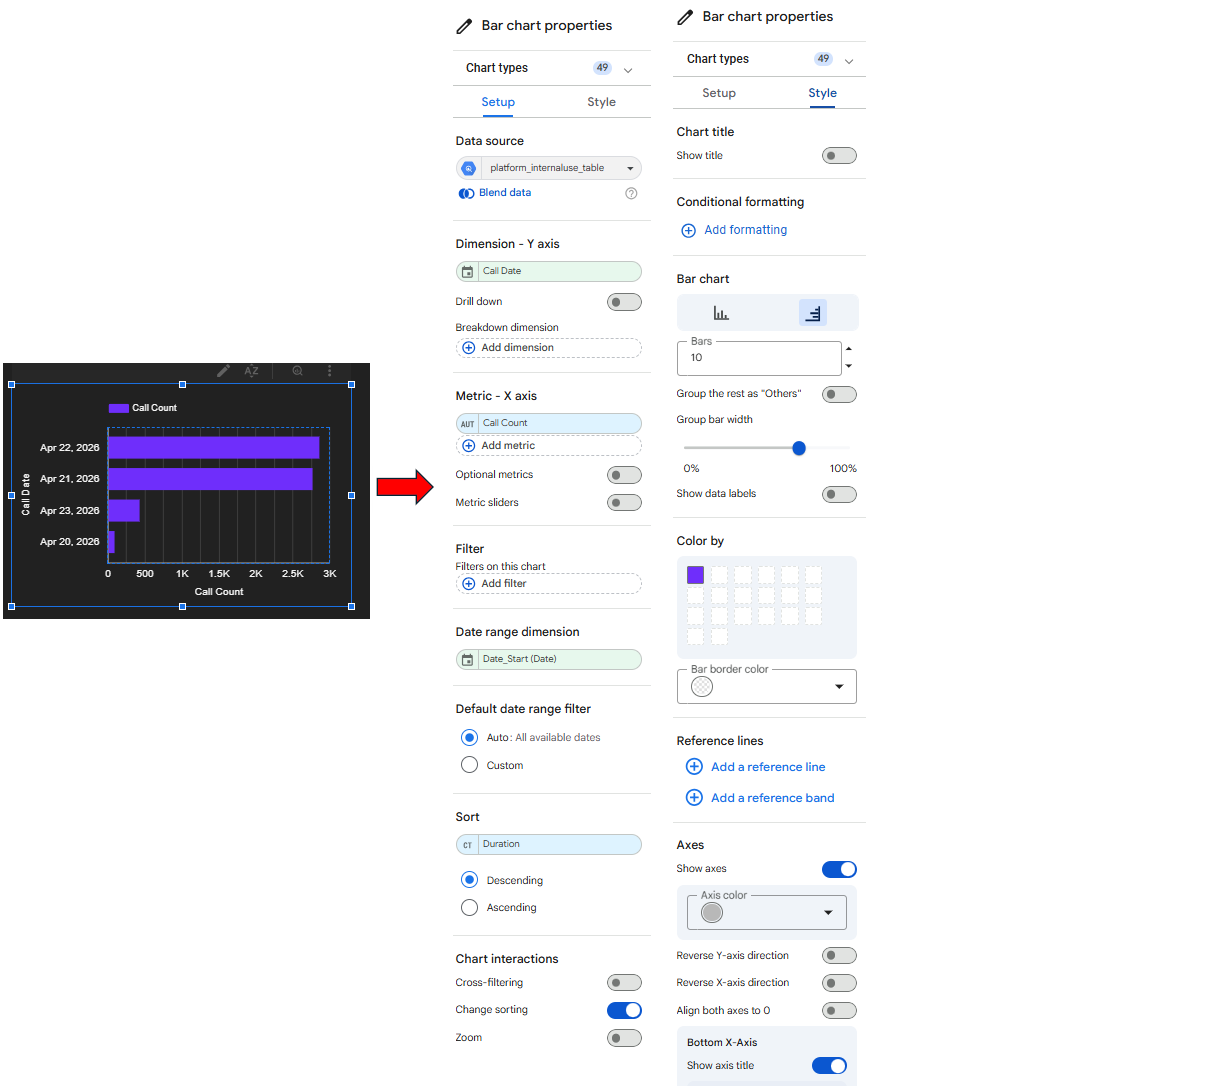
Clicking on an individual chart opens its settings and properties
*Clicking on a pie chart opens up the ‘Setup’ and ‘Style options for the chart
*In the ‘Setup’ option, you can select the Data source, Metrics, Filters etc.
*In the ‘Style’ option, you can add Chart title, Labels and Styling
*Clicking on a bar chart opens up the ‘Setup’ and ‘Style options for the chart
*In the ‘Setup’ option, you can select the Data source, Metrics, Filters etc.
*In the ‘Style’ option, you can add Chart title, Labels and Styling
Report Sharing & Downloading
Click on ‘Share’ to share the report with other people in your organization.
You can also download the report and share it in PDF.
Creating SMS Visualisation
To add SMS data visualization, you will need to import the SMS data source from BigQuery in Looker studio
1.- Create a new page to create SMS visualisations
2 & 3.- Click ‘Add Data’ followed by BigQuery to add the new SMS data table in Looker Studio from BigQuery
4.- Select the correct Project, Dataset and Table and click ‘Add’ to import the table in Looker.
Note: Any changes to the table in Big Query will automatically be reflected in your visualisations in the Looker studio. Data refresh is near real-time in Looker studio.
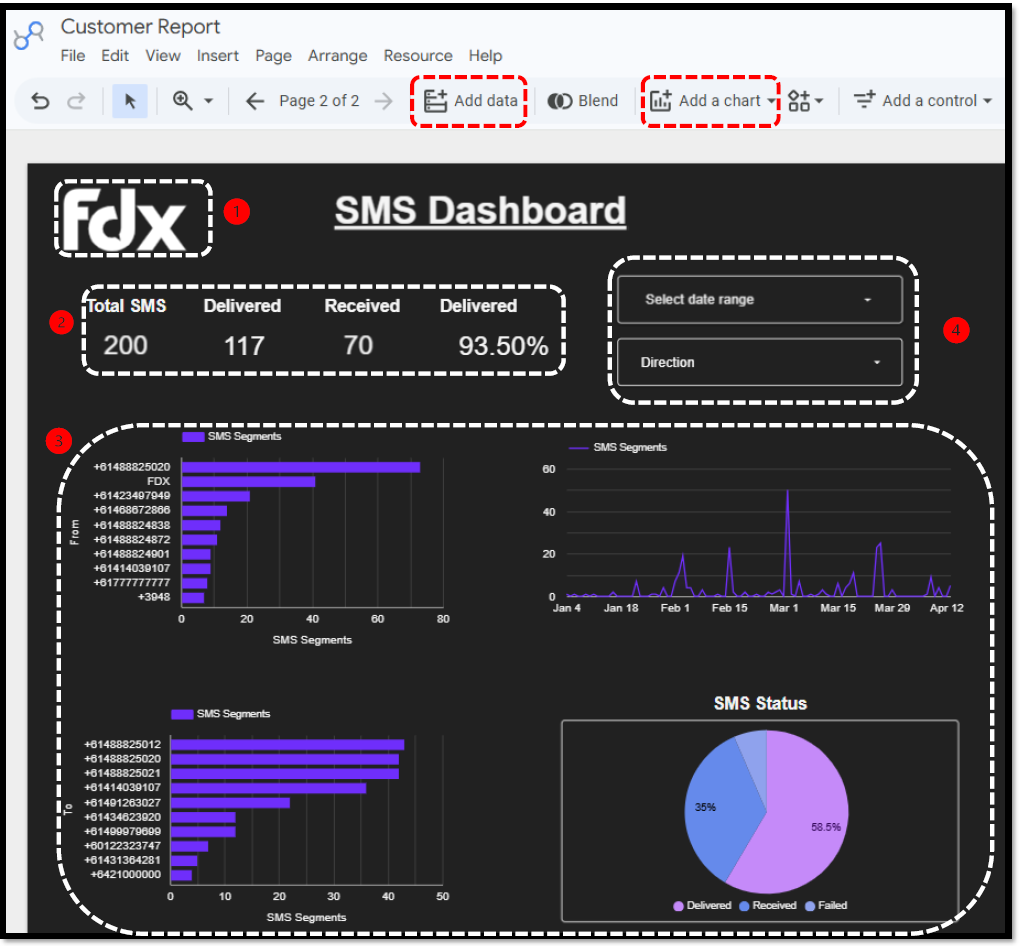
The picture below shows a typical SMS dashboard for a customer
1.- Company logo can be added here
2.-Scorecard added from the ‘Add a Chart’ section
3.- Bar/line/pie charts created from ‘Add a Chart’ section
4.- Filters created from ‘Add a Control’ section
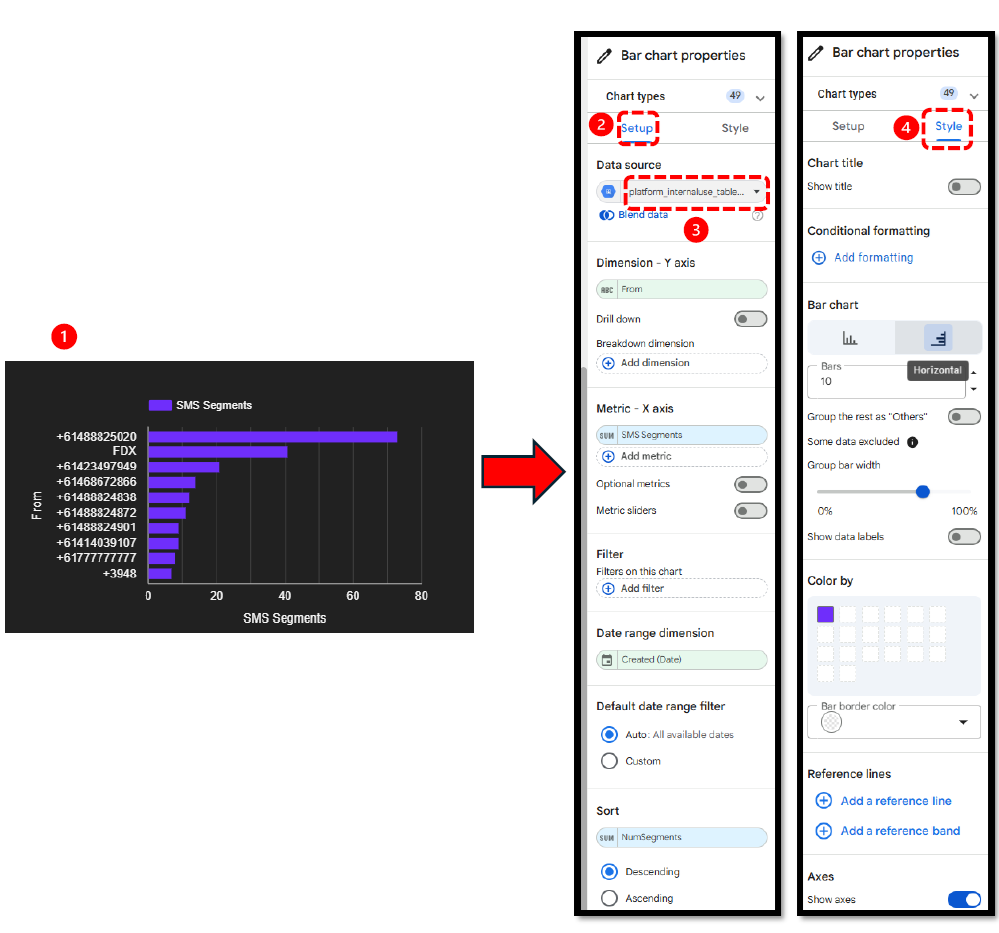
Clicking on an individual chart opens its settings and properties
1.- Clicking on a bar chart opens up the ‘Setup’ and ‘Style options for the chart
2.- In the ‘Setup’ option, you can select the Data source, Metrics, Filters etc.
3.- Make sure you have selected the correct data source for the SMS data (this is because voice and SMS have separate data sources in the same report)
4.- In the ‘Style’ option, you can add Chart title, Labels and Styling
Was this article helpful?
That’s Great!
Thank you for your feedback
Sorry! We couldn't be helpful
Thank you for your feedback
Feedback sent
We appreciate your effort and will try to fix the article